- Aim for production quality plots here: title, axis labels, no overplotting.
- Can set figure options in r chunk (
fig.height,fig.width,fig.align). - Questions 7 and 8 are best answered with 2 plots, but one could suffice.
- Be sure stuff compiles right on the last question. Don't forget to submit images on moodle!
Homework #2
Numerical descriptors
Two (numerical) Variables
- Shape: linear, quadratic
- Direction: positive/neg in slope/curvature
- Strength: how tightly clustered?
A measure of the strength of a linear relationship: r, the correlation coefficient (cor()).
Graphical descriptors
Scatterplot (base)
plot(x = nc$fage, y = nc$mage)
Graphical descriptors
Scatterplot (base)
plot(mage ~ fage, data = nc)
Graphical descriptors
Scatterplot (ggplot2)
ggplot(nc, aes(x = fage, y = mage)) + geom_point()
ggplot2 sandbox
mplot(nc)
mplot(mtcars, default = "histogram")
Two univariate distributions
par(mfrow = c(2,1))
plot(density(d$activity), xlim = c(1000000, 1500000), main = "")
plot(density(d$homework), xlim = c(1000000, 1500000), main = "")
Two univariate distributions
One bivariate distribution: scatterplot
ggplot(data=d, aes(x=activity, y=homework)) + geom_jitter() + theme(legend.position="none") + labs(title="")
Contour plot
Image plot / heat map
Perspective plot
Getting beyond 2 dimensions

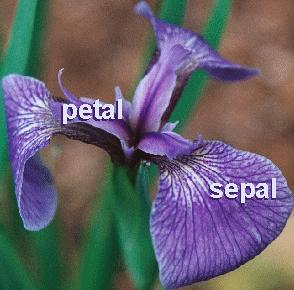
Fisher's Irises: Is there a relationship between sepal length and sepal width of irises? I.e., if you have measurements on one, can you predict what the other will be?
Getting beyond 2 dimensions
ggplot(data=iris, aes(x=Sepal.Length, y=Sepal.Width)) + geom_jitter() + theme(legend.position="none") + labs(title="Iris Data")
Getting beyond 2 dimensions
Fisher's Irises: Is there a relationship between sepal length and sepal width of irises? I.e., if you have measurements on one, can you predict what the other will be?
No…but what about if you incorporate a third variable: species?
Getting beyond 2 dimensions
ggplot(data=iris, aes(x=Sepal.Length, y=Sepal.Width)) + geom_point() + facet_wrap(~Species, ncol=4) + theme(legend.position="none") + labs(title="")
Getting beyond 2 dimensions
You can add a third (categorical) variable by:
Color: mapping the category of that observation to a discrete color scale.
Faceting: separate out the data and make a scatterplot for each category. (preferable if the data is dense).
Key idea: Once you get into >2 dimenions, you can describe the structure jointly or conditioning/controlling for certain variables.
Getting beyond 2 dimensions
You can add a third (numerical) variable by:
Color: map the variable of that observation to a continuous color scale.
Size: map the variable to the size of that point.
Euclidian dimension: add a third dimension!
3D scatterplot
3D scatterplot
3D density plot
Visualizations in yet higher dimensions
http://www.gapminder.org/world
How many variables/columns/dimensions are displayed?
Is there any structure that is persistent over an entire variable?
How would you characterize the relationship between fertility and life expectancy during the 1950s and 1960s when comparing the industrialized western nations to the rest of the world?