Two univariate distributions
Two univariate distributions
Bivariate data: scatterplot
Marginal and Joint
Contour plot
Image plot / heat map
Perspective plot
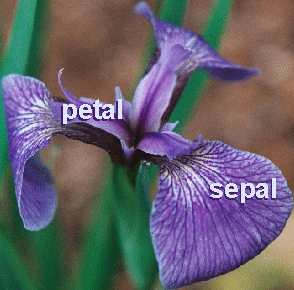
Fisher's Irises

Fisher's Irises: Is there a relationship between sepal length and sepal width of irises? I.e., if you have measurements on one, can you predict what the other will be?
Fisher's Irises
Conditioning
Question: what is the relationship between species and sepal width when comparing irises of the same length?
Two step process:
Collect (subset) the flowers that are of the same length.
Plot the relationship of width and species.
Conditioning
- Let's consider the flowers around 5.5 cm in length.
nrow(iris)
## [1] 150
iris_slice <- iris[iris$Sepal.Length > 5.0 & iris$Sepal.Length < 6.0, ]
nrow(iris_slice)
## [1] 51
Conditioning
- Plot (density plots) the relationship between width and species in this slice.
Conditioning
- Plot (boxplots) the relationship between width and species in this slice.
3D scatterplot
3D density plot
Data in yet higher dimensions
http://www.gapminder.org/world
How many variables/columns/dimensions are displayed?
Is there any structure that is persistent over an entire variable?
How would you characterize the relationship between fertility and life expectancy during the 1950s and 1960s when comparing the industrialized western nations to the rest of the world?